The Fallacy of Short-Term Investing: A Data-Driven Analysis
The Fallacy of Short-Term Investment: A Data-Driven Analysis
Investing in the financial markets is a strategic endeavor that requires careful planning, patience, and a clear understanding of market dynamics. One of the most debated topics in the investment world is the efficacy of short-term versus long-term investment strategies. This article aims to shed light on this subject, using data and insights from a comprehensive study conducted by the Wells Fargo Investment Institute.
The study, titled "The perils of trying to time volatile markets," provides compelling evidence against the practice of short-term investing, particularly in volatile markets. It argues that attempting to time the market, especially during periods of high volatility, is a risky strategy that often yields subpar results.
The study, titled "The perils of trying to time volatile markets," provides compelling evidence against the practice of short-term investing, particularly in volatile markets. It argues that attempting to time the market, especially during periods of high volatility, is a risky strategy that often yields subpar results.

The Perils of Missing the Best Days
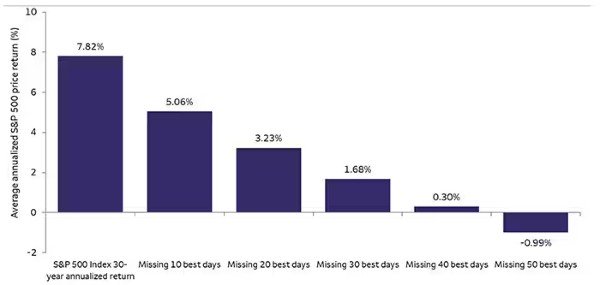
One of the key takeaways from the study is the significant impact of missing the best days in the market. The research suggests that missing just a handful of the best days over long time periods can drastically reduce the average annual return an investor could gain by simply holding on to their equity investments during market sell-offs.
For instance, over the past 30 years, missing the best 20 days (based on S&P 500 Index returns from September 1, 1992 through August 31, 2022) took the annual average return from 7.8% per year down to 3.2%, which was less than the 3.3% average inflation rate over that same period. Missing the best 40 days took the average annual return to 0.3%, and missing the best 50 days resulted in an average of -0.99% annual return.
For instance, over the past 30 years, missing the best 20 days (based on S&P 500 Index returns from September 1, 1992 through August 31, 2022) took the annual average return from 7.8% per year down to 3.2%, which was less than the 3.3% average inflation rate over that same period. Missing the best 40 days took the average annual return to 0.3%, and missing the best 50 days resulted in an average of -0.99% annual return.

The Difficulty of Timing the Market
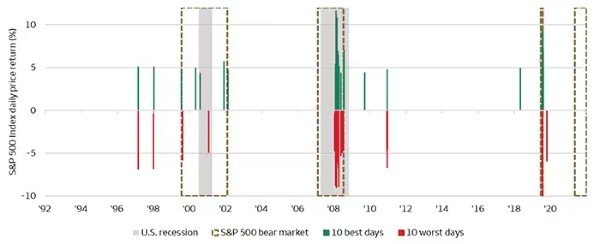
The study also highlights the difficulty of timing the market. It points out that the best and worst trading days often occur in close proximity, sometimes even on consecutive days. This makes it extremely challenging to disentangle the best and worst days, and to accurately predict market movements.
For example, of the 10 best trading days in terms of percentage gains, all 10 took place during recessions and six took place during a bear market. This suggests that significant gains can be made even during periods of economic downturn, further emphasizing the importance of staying invested over the long term.
For example, of the 10 best trading days in terms of percentage gains, all 10 took place during recessions and six took place during a bear market. This suggests that significant gains can be made even during periods of economic downturn, further emphasizing the importance of staying invested over the long term.

The Benefits of Long-Term Investing
The study concludes that staying fully invested in equity markets over a full market cycle is more beneficial than selling into volatile markets and attempting to avoid the worst-performing days. It suggests that investors may wish to use tactical asset allocation to reduce equity exposure when the risk of a recession and bear market rises and increase equity exposure as the economy and markets recover.
Moreover, the study advocates for regular portfolio rebalancing during periods of market volatility. This can help ensure that a portfolio’s allocation stays diversified and aligned with desired goals. Diversification has the potential to provide more consistent returns and less downside risk through lowered volatility.
Moreover, the study advocates for regular portfolio rebalancing during periods of market volatility. This can help ensure that a portfolio’s allocation stays diversified and aligned with desired goals. Diversification has the potential to provide more consistent returns and less downside risk through lowered volatility.


The DALBAR Study and Market Timing
The DALBAR study, a cornerstone of the Wells Fargo report, offers a comprehensive analysis of investor behavior and its impact on investment returns. In 2020, the average equity fund investor underperformed the S&P 500 by 131 basis points (18.40% for S&P 500 vs. 17.09% for Average Equity Fund Investor). However, in 2021, the gap widened significantly, with the average equity fund investor earning a return of 18.39% versus an S&P 500 return of 28.71% - a substantial investor return gap of 10.32%. This was the third-largest annual gap since 1985, when DALBAR's Quantitative Analysis of Investor Behavior (QAIB) analysis began.
The DALBAR study also introduced the concept of the "Guess Right Ratio," which measures how often investors correctly anticipate the direction of the market the following month. The findings revealed that investors guessed right at least half the time in 11 out of the past 20 years, but only four times in 2021. However, the dollar volume of incorrect guesses often exceeded that of correct ones, leading to suboptimal gains. Even a single month of wrong guesses can potentially negate the gains from several months of correct ones.
Furthermore, DALBAR's analysis of retention rates - the length of time the average investor holds a fund if the current redemption rate persists - showed that these rates typically increase during market upturns and decrease during downturns. This suggests that when the market is doing well, more average investors tend to buy into the market, and when the market goes down, then the average investors tend to sell off their positions. This behavior, driven by fear during downturns and greed during upturns, underscores why many financial advisors recommend a long-term, buy-and-hold strategy.
Conclusion
In conclusion, the data strongly supports the argument for long-term investing over short-term market timing. While short-term investing may seem appealing during periods of market volatility, the evidence suggests that it is a fallacy with no substantial data to back it up. On the other hand, staying invested and buying more over time has plenty of data to show that it works, providing a compelling case for the merits of long-term investing.

